Create a ggplot object used for plot aggregation.
Usage
ggAPA(
  apa.mtx = NULL,
  title.chr = NULL,
  trimPrct.num = 0,
  bounds.chr = "both",
  colMin.num = NULL,
  colMid.num = NULL,
  colMax.num = NULL,
  colBreaks.num = NULL,
  blurPass.num = 0,
  blurBox.num = NULL,
  blurSize.num = NULL,
  blurSd.num = 0.5,
  lowerTri.num = NULL,
  heatmap.col = NULL,
  na.col = "#F2F2F2",
  colorScale.chr = "linear",
  bias.num = 1,
  paletteLength.num = 51
)
Arguments
- apa.mtx
<matrix> : The matrix to plot. (Default NULL)
- title.chr
<character> : The title of plot. (Default NULL)
- trimPrct.num
<numeric> : A number between 0 and 100 that give the percentage of trimming. (Default 0)
- bounds.chr
<character> : Which boundary must be trim, if it's both, trim half of the percentage in inferior and superior see QtlThreshold. (Default "both")
- colMin.num
<numeric> : Minimal value of Heatmap, force color range. If Null automaticaly find. (Default NULL)
- colMid.num
<numeric> : Center value of Heatmap, force color range. If Null automaticaly find. (Default NULL)
- colMax.num
<numeric> : Maximal value of Heatmap, force color range. If Null automaticaly find. (Default NULL)
- colBreaks.num
<numeric> : Repartition of colors. If Null automaticaly find. (Default NULL)
- blurPass.num
<numeric> : Number of blur pass. (Default 0)
- blurBox.num
<numeric> : If NULL automaticaly compute for 3 Sd. (Default NULL)
- blurSize.num
<numeric> : Size of box applied to blurr if null automaticaly compute for 3 Sd. (Default NULL)
- blurSd.num
<numeric> : SD of gaussian smooth. (Default 0.5)
- lowerTri.num
<numeric> : The value that replace all value in the lower triangle of matrice (Usefull when blur is apply). (Default NULL)
- heatmap.col
<character> : Heatmap color list. If NULL automaticaly compute. (Default NULL)
- na.col
<character> : Color of NA values. (Default "#F2F2F2")
- colorScale.chr
<character> : Shape of color scale on of "linear" or "density" based. (Default "linear")
- bias.num
<numeric> : A positive number. Higher values give more widely spaced colors at the high end. See ?grDevices::colorRamp for more details. (Default 1)
- paletteLength.num
<numeric> : The number of color in the palette. (Default 51)
Examples
# Data
data(Beaf32_Peaks.gnr)
data(HiC_Ctrl.cmx_lst)
# Index Beaf32
Beaf32_Index.gnr <- IndexFeatures(
gRange.gnr_lst = list(Beaf = Beaf32_Peaks.gnr),
chromSize.dtf = data.frame(seqnames = c("2L", "2R"), seqlengths = c(23513712, 25286936)),
binSize.num = 100000
)
# Beaf32 <-> Beaf32 Pairing
Beaf_Beaf.gni <- SearchPairs(indexAnchor.gnr = Beaf32_Index.gnr)
Beaf_Beaf.gni <- Beaf_Beaf.gni[seq_len(2000)] # subset 2000 first for exemple
# Matrices extractions center on Beaf32 <-> Beaf32 point interaction
interactions_PF.mtx_lst <- ExtractSubmatrix(
feature.gn = Beaf_Beaf.gni,
hic.cmx_lst = HiC_Ctrl.cmx_lst,
referencePoint.chr = "pf"
)
# Aggregate matrices in one matrix
aggreg.mtx <- Aggregation(interactions_PF.mtx_lst)
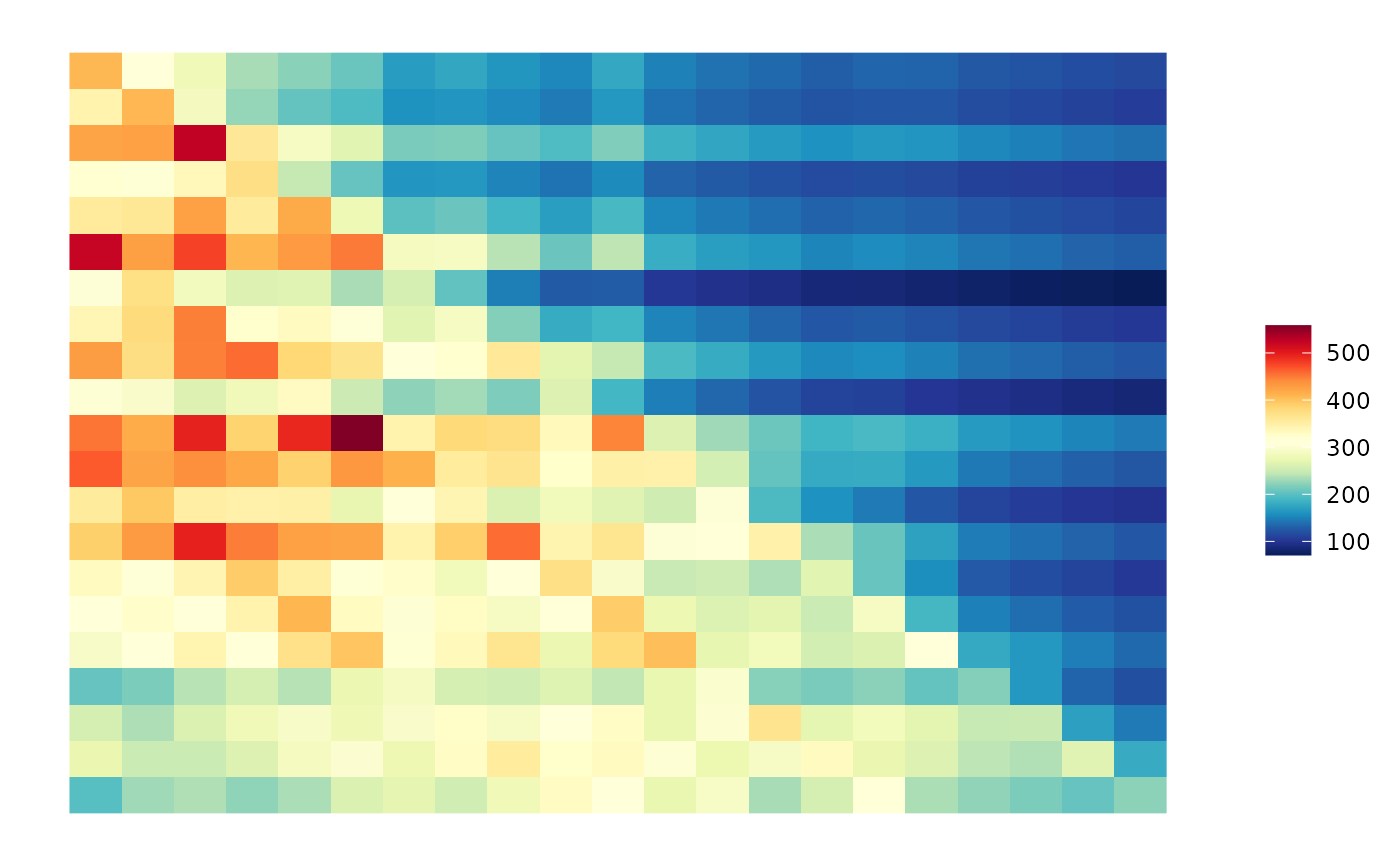
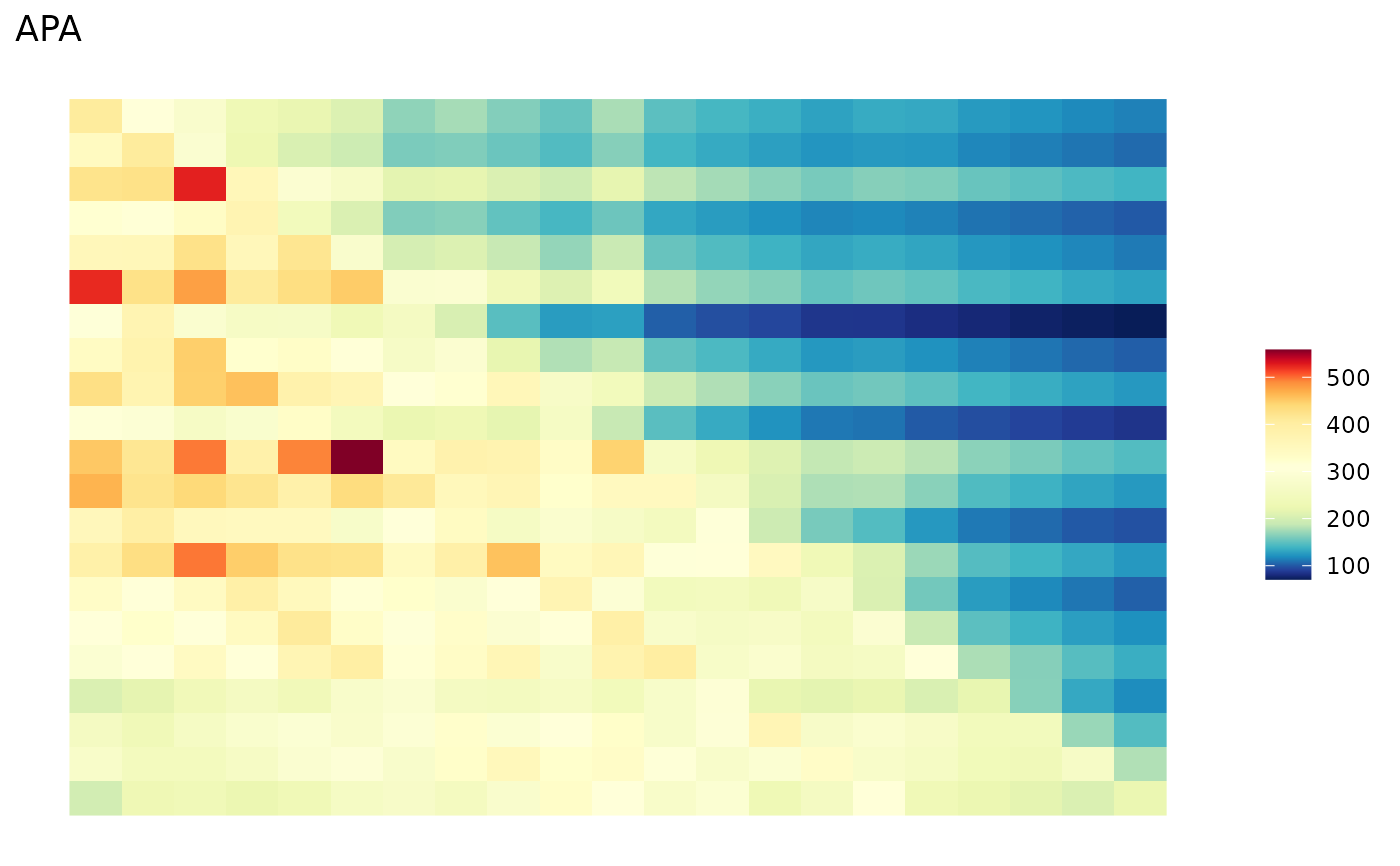
# Visualization
ggAPA(
apa.mtx = aggreg.mtx
)
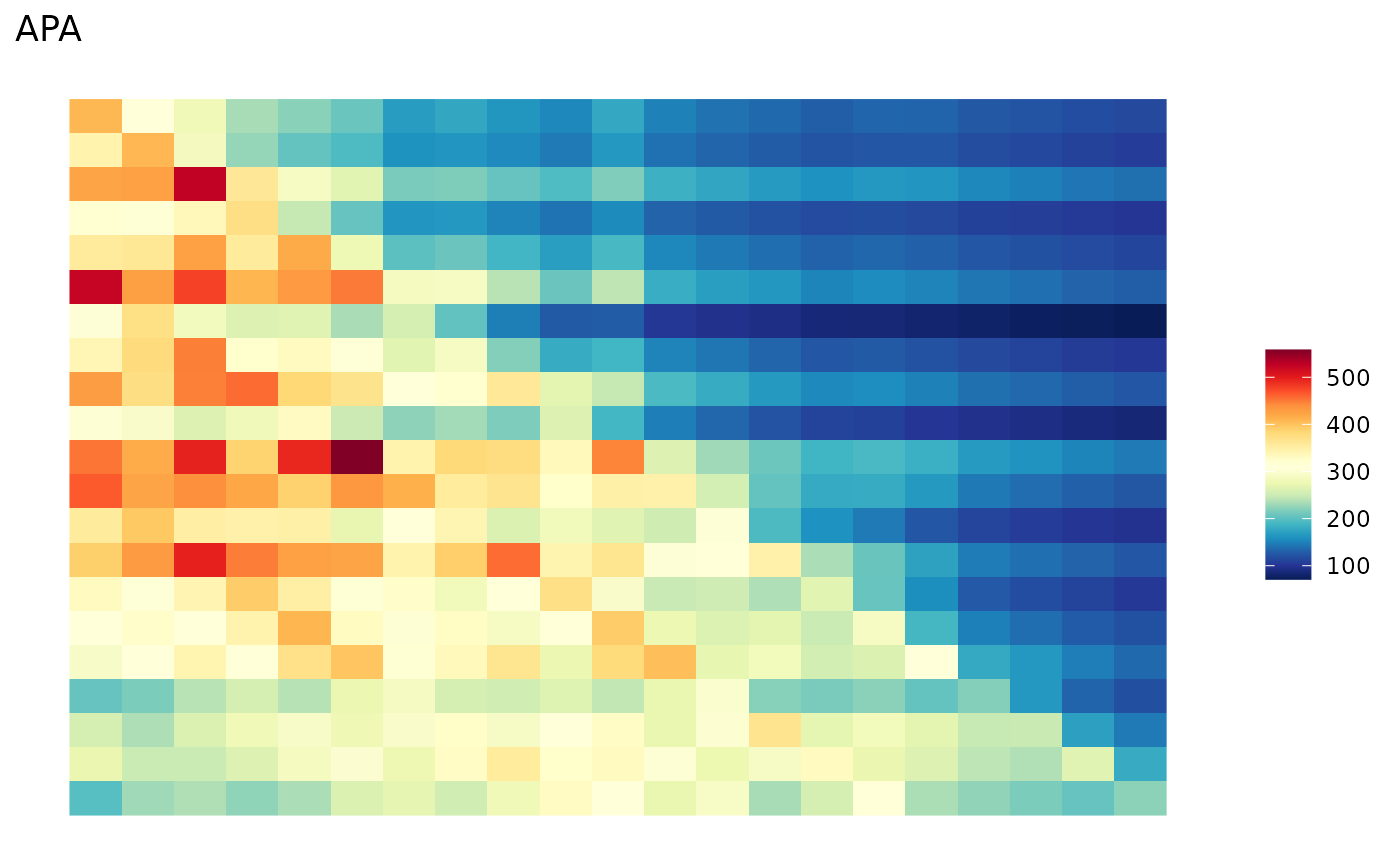
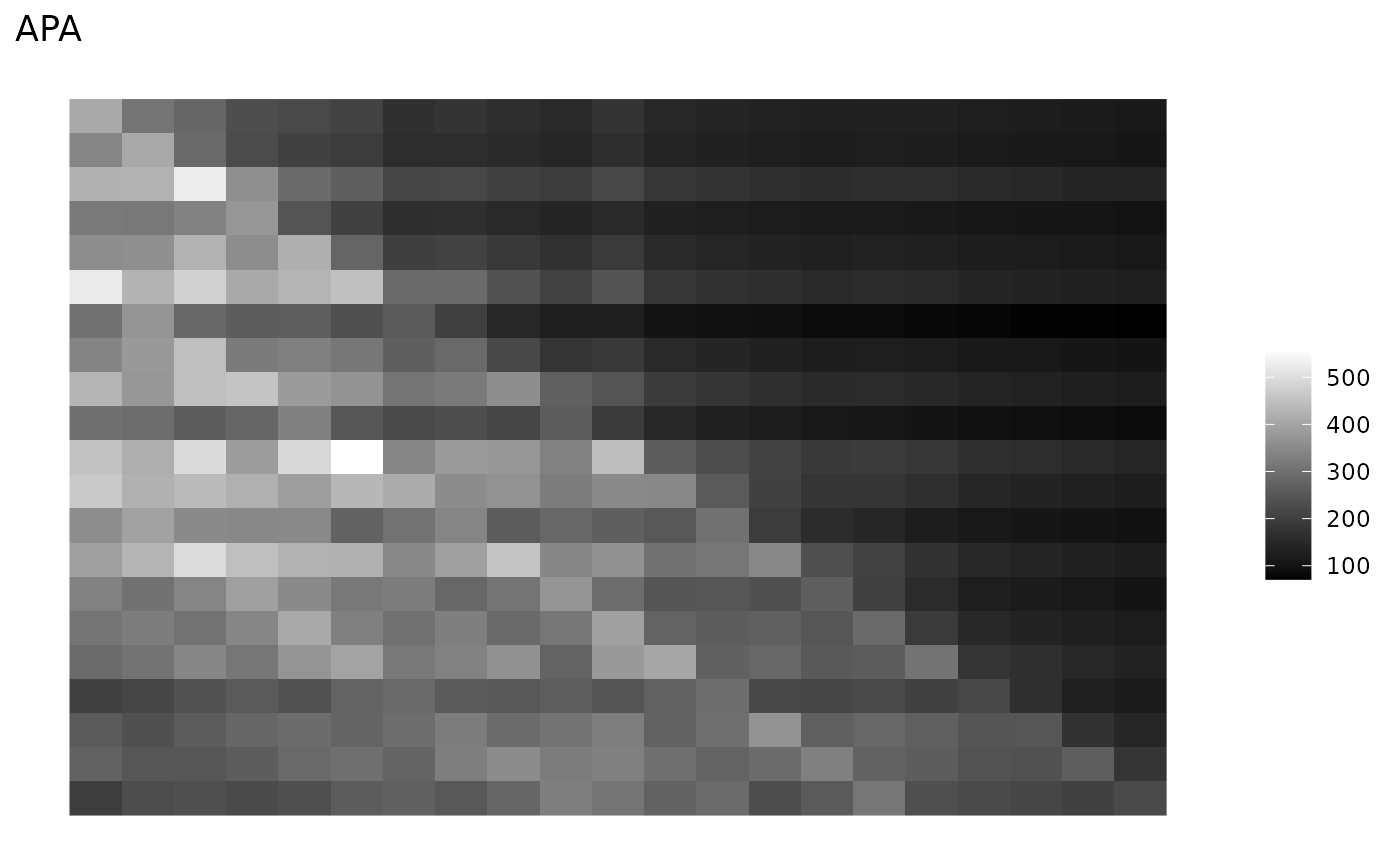
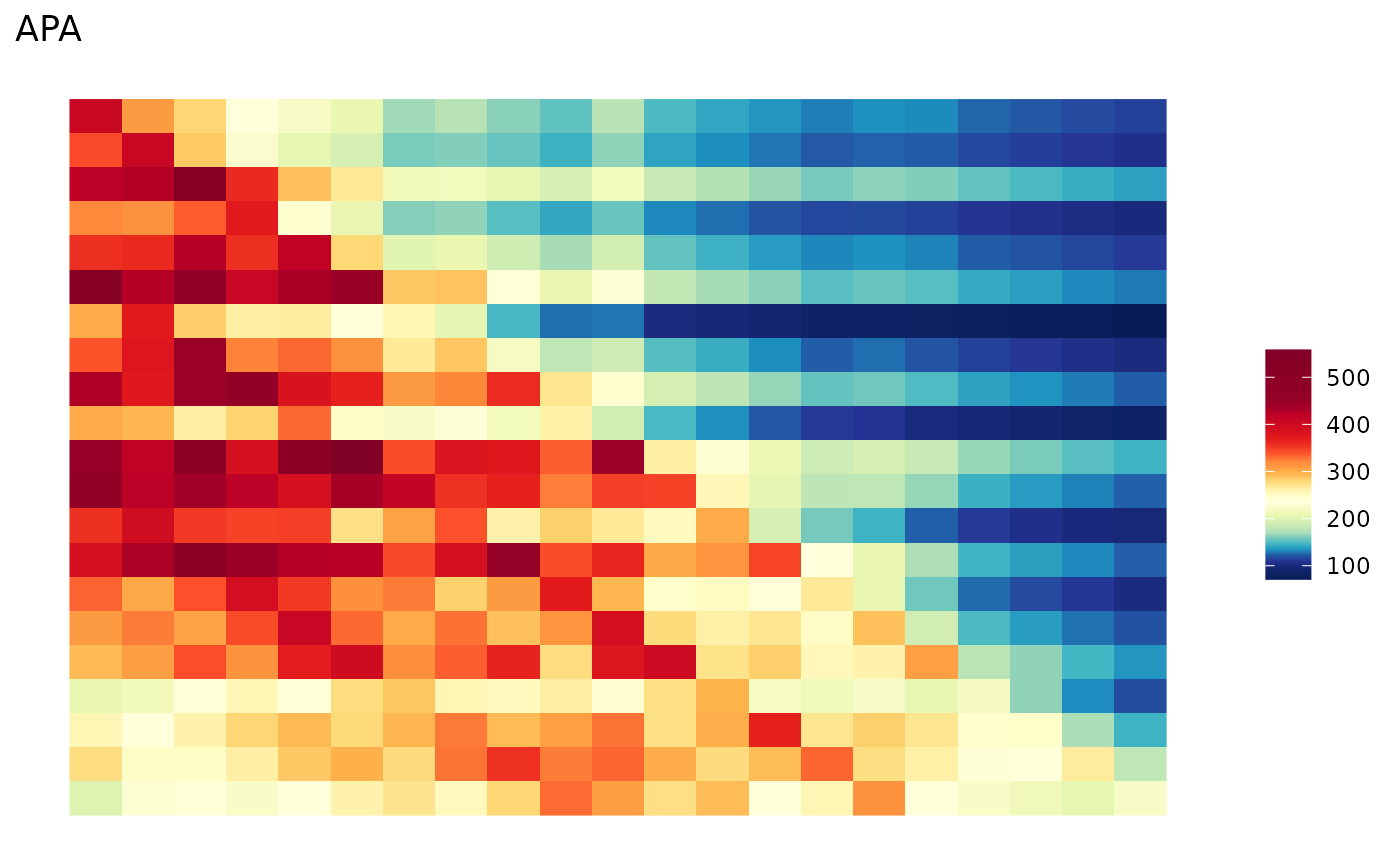
 # Add Title
ggAPA(
apa.mtx = aggreg.mtx,
title.chr = "APA"
)
# Add Title
ggAPA(
apa.mtx = aggreg.mtx,
title.chr = "APA"
)
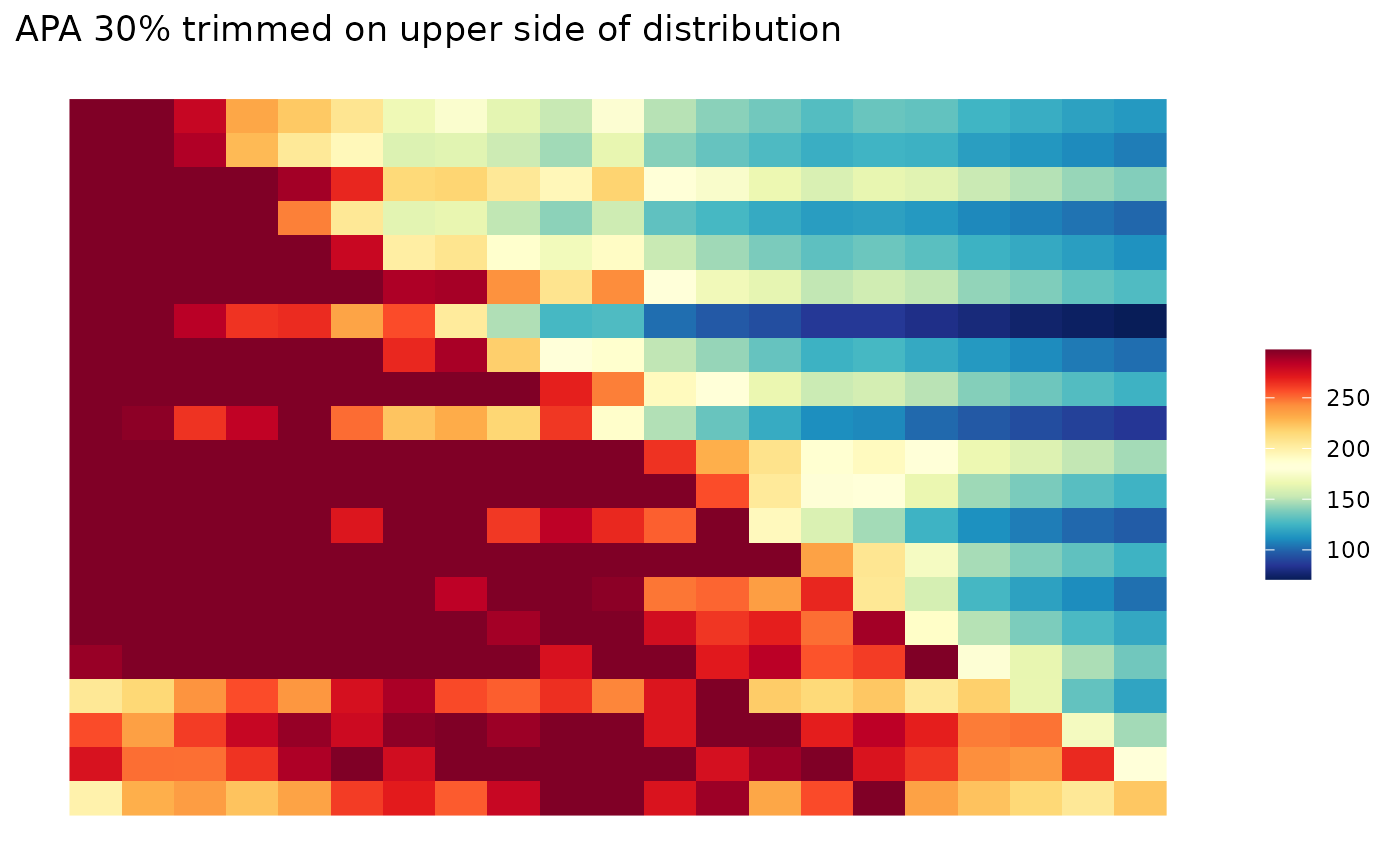
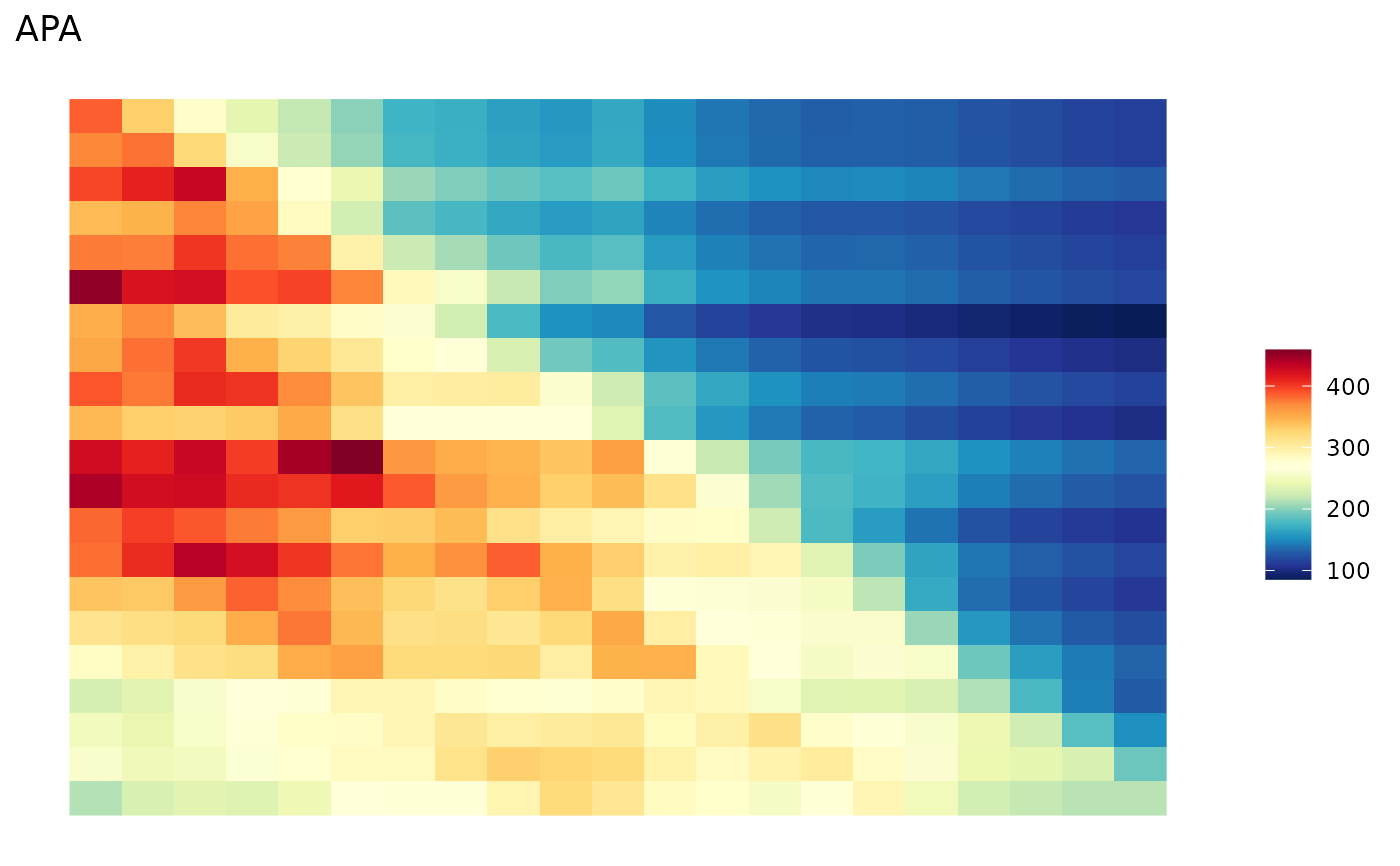
 # Trim values
ggAPA(
apa.mtx = aggreg.mtx,
title.chr = "APA 30% trimmed on upper side of distribution",
trimPrct.num = 30,
bounds.chr = "upper"
)
#> Warning: no non-missing arguments to max; returning -Inf
# Trim values
ggAPA(
apa.mtx = aggreg.mtx,
title.chr = "APA 30% trimmed on upper side of distribution",
trimPrct.num = 30,
bounds.chr = "upper"
)
#> Warning: no non-missing arguments to max; returning -Inf
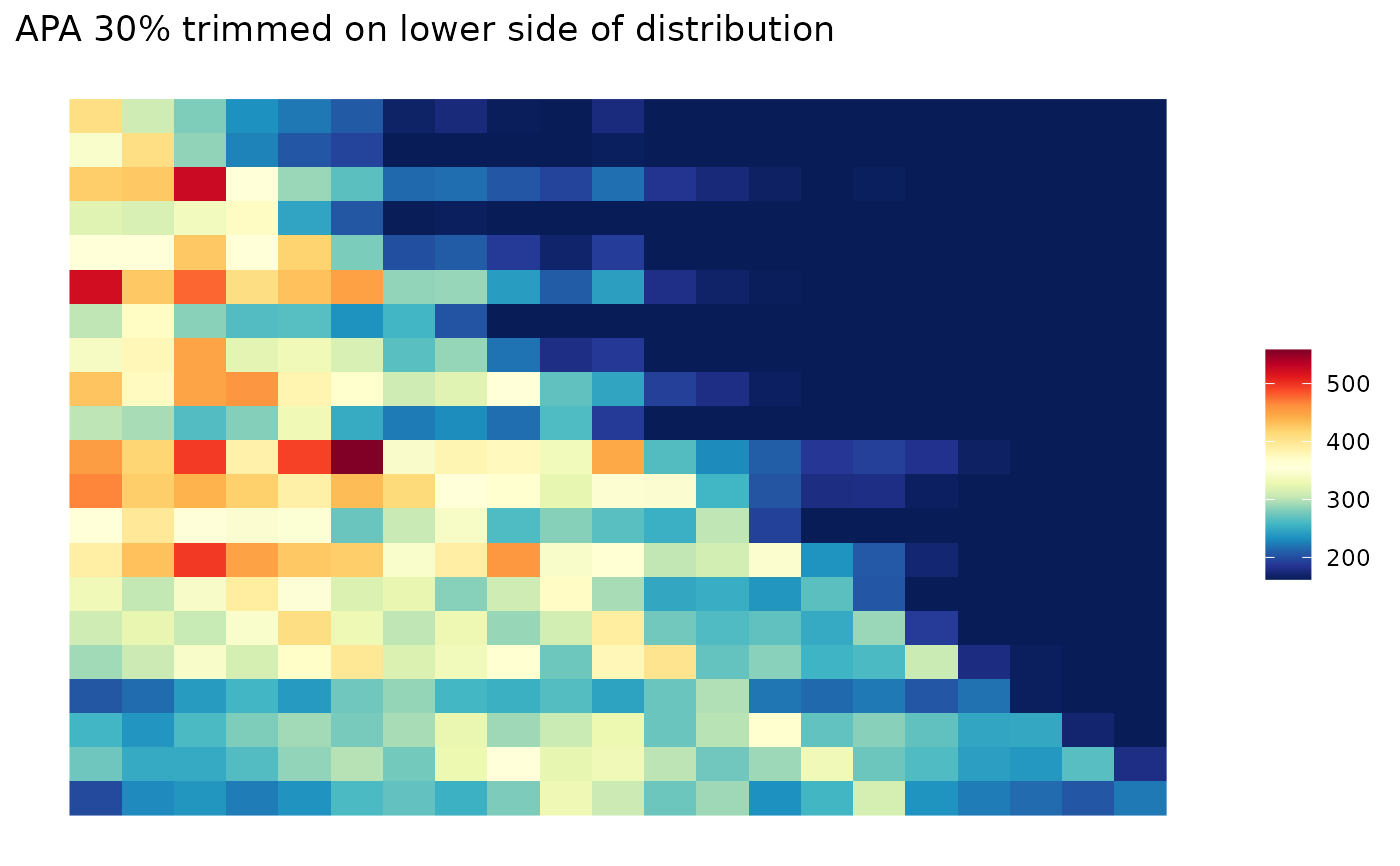
 ggAPA(
apa.mtx = aggreg.mtx,
title.chr = "APA 30% trimmed on lower side of distribution",
trimPrct.num = 30,
bounds.chr = "lower"
)
#> Warning: no non-missing arguments to min; returning Inf
ggAPA(
apa.mtx = aggreg.mtx,
title.chr = "APA 30% trimmed on lower side of distribution",
trimPrct.num = 30,
bounds.chr = "lower"
)
#> Warning: no non-missing arguments to min; returning Inf
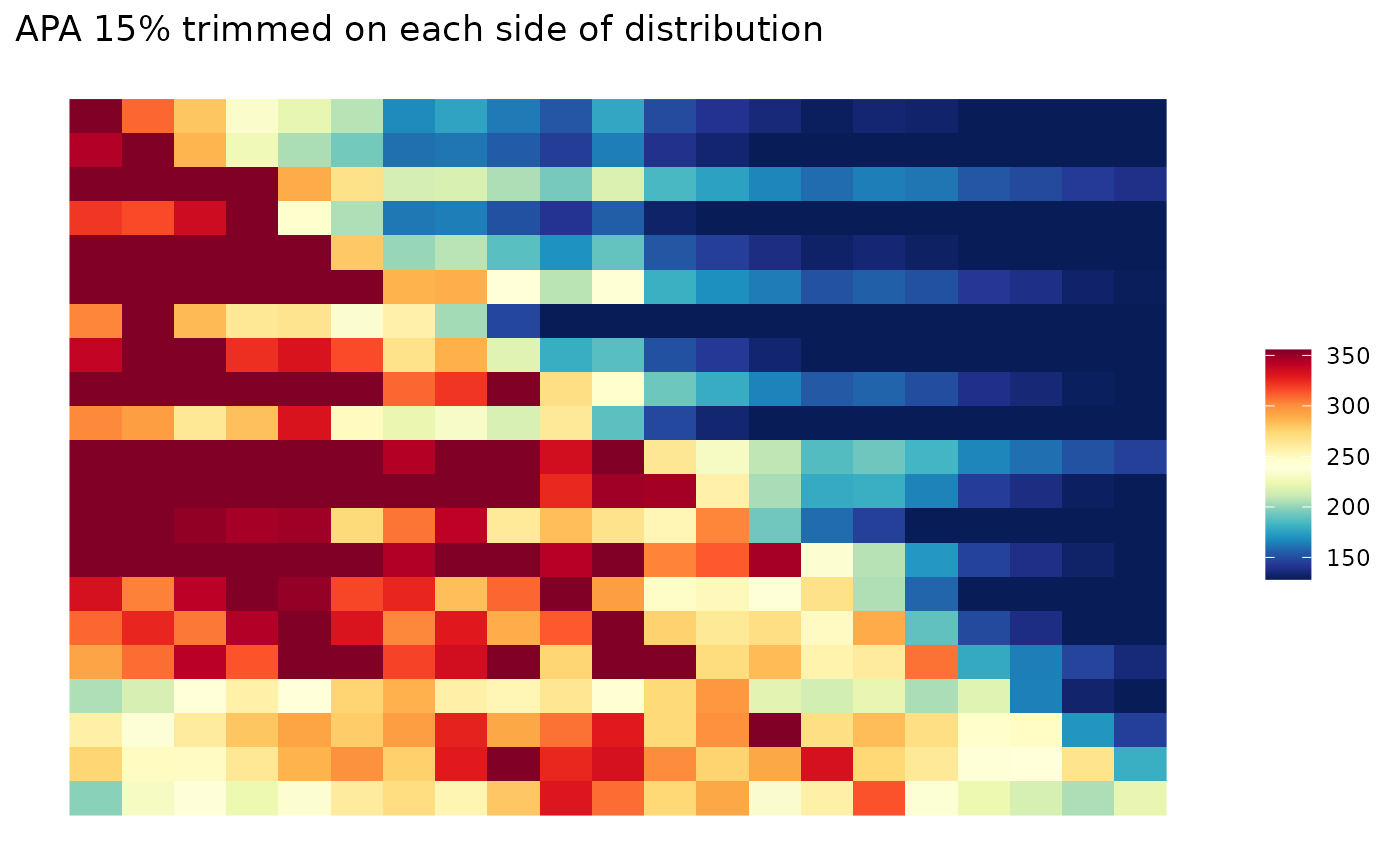
 ggAPA(
apa.mtx = aggreg.mtx,
title.chr = "APA 15% trimmed on each side of distribution",
trimPrct.num = 30,
bounds.chr = "both"
)
ggAPA(
apa.mtx = aggreg.mtx,
title.chr = "APA 15% trimmed on each side of distribution",
trimPrct.num = 30,
bounds.chr = "both"
)
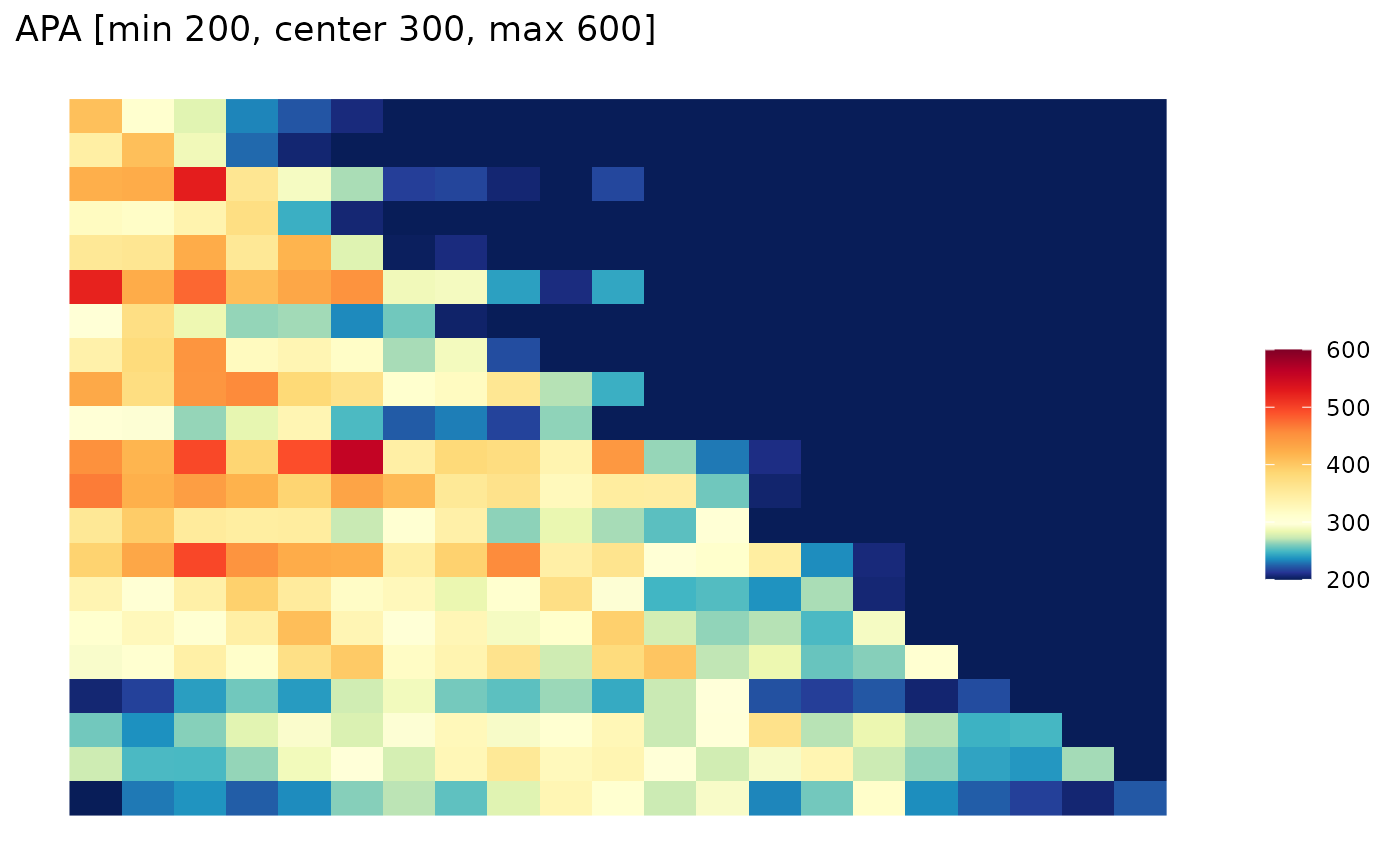
 # Change Minimal, Central and Maximal Colors scale value
ggAPA(
apa.mtx = aggreg.mtx,
title.chr = "APA [min 200, center 300, max 600]",
colMin.num = 200,
colMid.num = 300,
colMax.num = 600
)
# Change Minimal, Central and Maximal Colors scale value
ggAPA(
apa.mtx = aggreg.mtx,
title.chr = "APA [min 200, center 300, max 600]",
colMin.num = 200,
colMid.num = 300,
colMax.num = 600
)
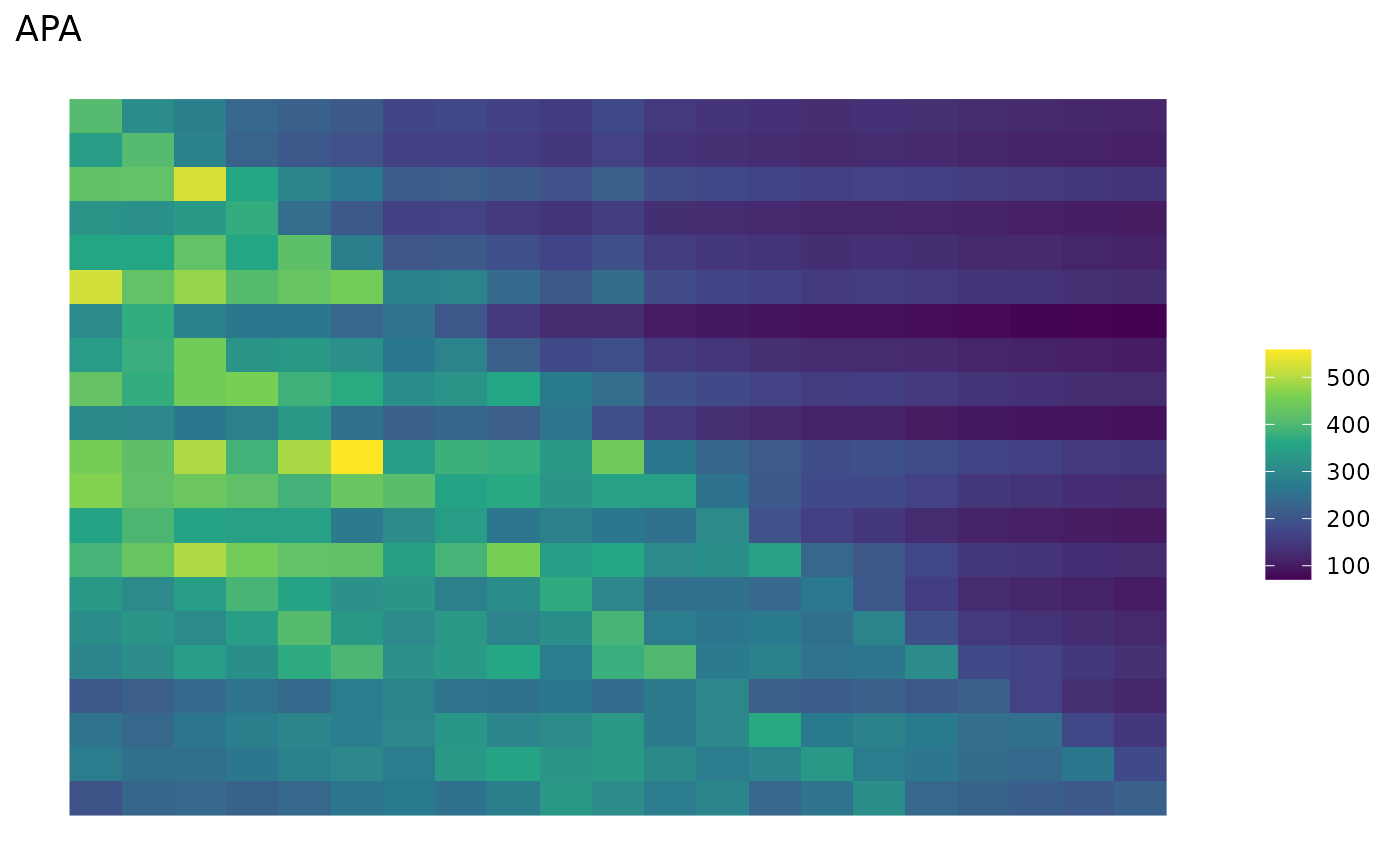
 # Change Color
ggAPA(
apa.mtx = aggreg.mtx,
title.chr = "APA",
heatmap.col = viridis(6),
na.col = "black"
)
# Change Color
ggAPA(
apa.mtx = aggreg.mtx,
title.chr = "APA",
heatmap.col = viridis(6),
na.col = "black"
)
 ggAPA(
apa.mtx = aggreg.mtx,
title.chr = "APA",
heatmap.col = c("black", "white"),
)
ggAPA(
apa.mtx = aggreg.mtx,
title.chr = "APA",
heatmap.col = c("black", "white"),
)
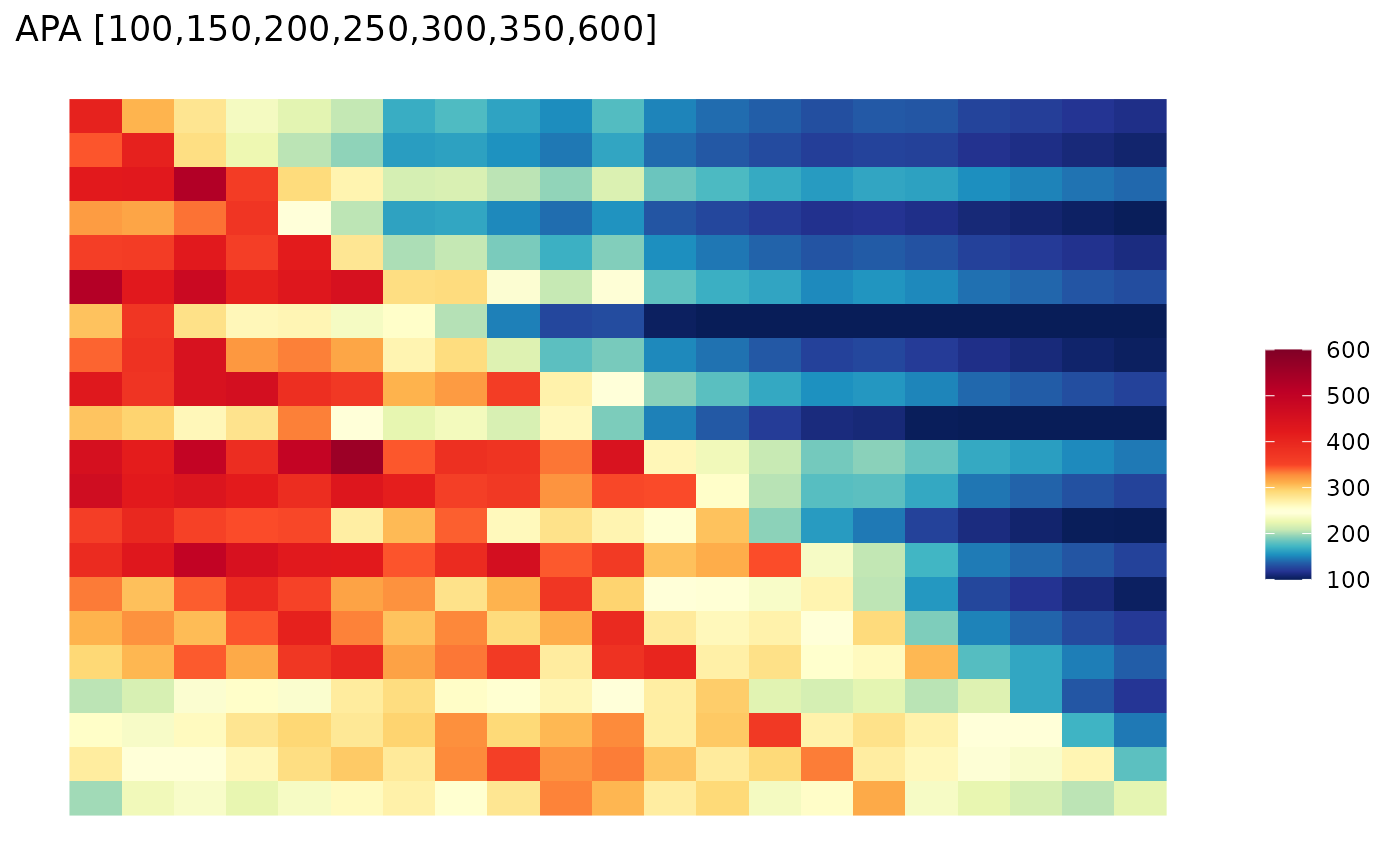
 # Change Color distribution
ggAPA(
apa.mtx = aggreg.mtx,
title.chr = "APA [100,150,200,250,300,350,600]",
colBreaks.num = c(100, 150, 200, 250, 300, 350, 600) # Choosen Breaks
)
# Change Color distribution
ggAPA(
apa.mtx = aggreg.mtx,
title.chr = "APA [100,150,200,250,300,350,600]",
colBreaks.num = c(100, 150, 200, 250, 300, 350, 600) # Choosen Breaks
)
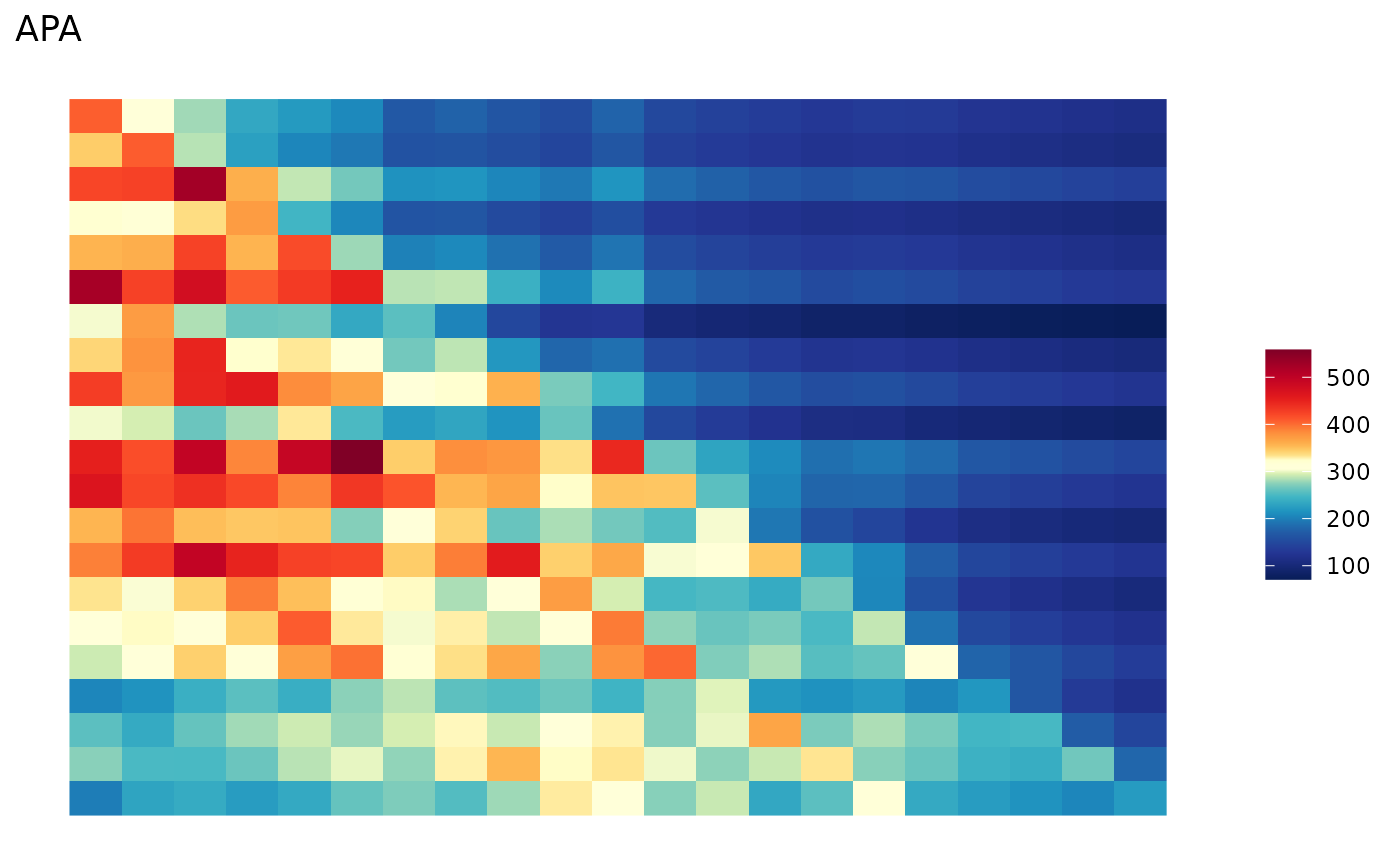
 ggAPA(
apa.mtx = aggreg.mtx,
title.chr = "APA",
colorScale = "density" # color distribution based on density
)
ggAPA(
apa.mtx = aggreg.mtx,
title.chr = "APA",
colorScale = "density" # color distribution based on density
)
 ggAPA(
apa.mtx = aggreg.mtx,
title.chr = "APA",
bias.num = 2 # (>1 wait on extremums)
)
ggAPA(
apa.mtx = aggreg.mtx,
title.chr = "APA",
bias.num = 2 # (>1 wait on extremums)
)
 ggAPA(
apa.mtx = aggreg.mtx,
title.chr = "APA",
bias.num = 0.5 # (<1 wait on center)
)
ggAPA(
apa.mtx = aggreg.mtx,
title.chr = "APA",
bias.num = 0.5 # (<1 wait on center)
)
 # Apply a Blurr
ggAPA(
apa.mtx = aggreg.mtx,
title.chr = "APA",
blurPass.num = 1,
blurSd.num = 0.5
)
# Apply a Blurr
ggAPA(
apa.mtx = aggreg.mtx,
title.chr = "APA",
blurPass.num = 1,
blurSd.num = 0.5
)
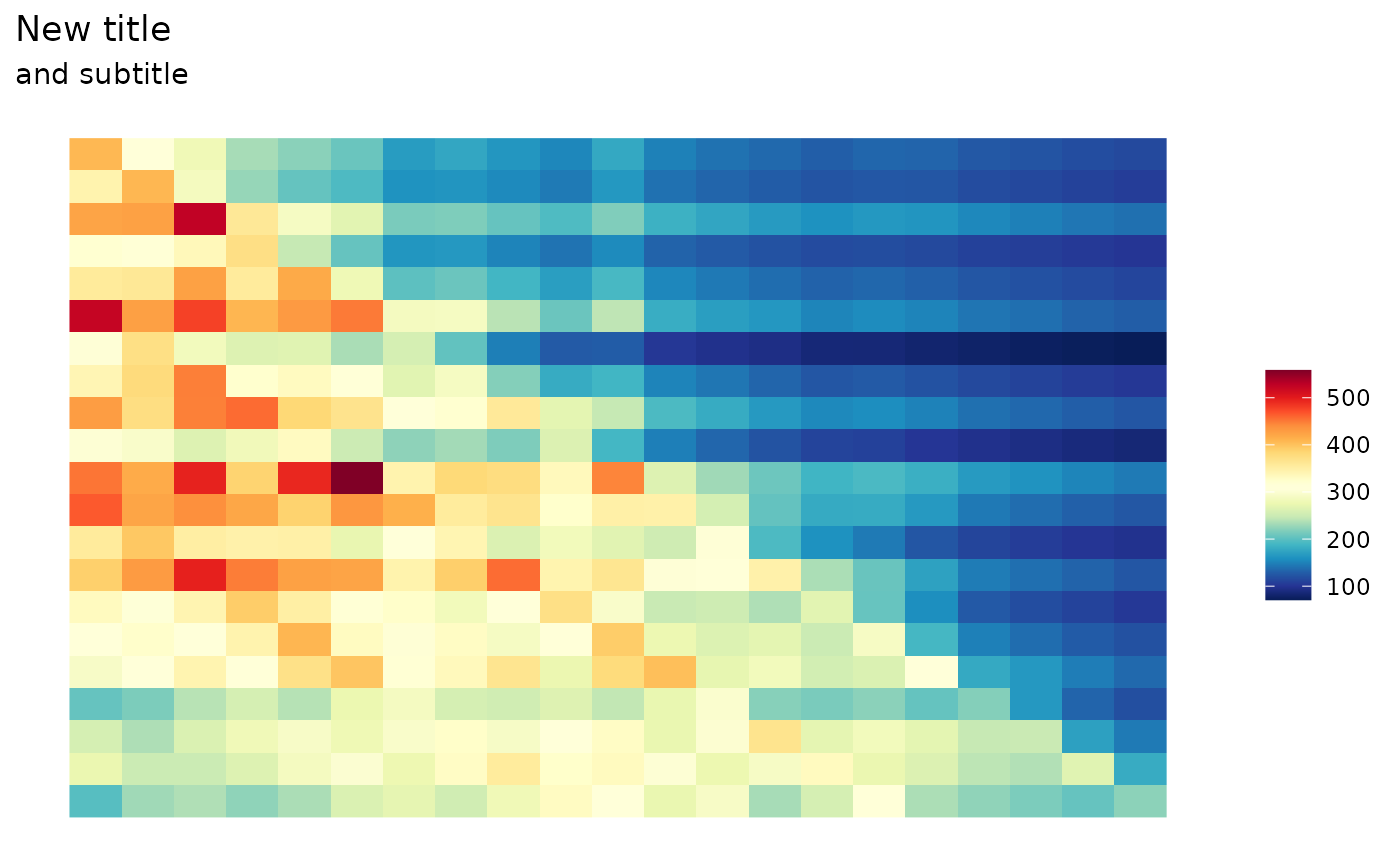
 # ggplot2 object modifications
# Since the function returns a ggplot object, it is possible
# to modify it following the ggplot2 grammar.
ggAPA(
apa.mtx = aggreg.mtx,
title.chr = "APA",
) +
ggplot2::labs(
title = "New title",
subtitle = "and subtitle"
)
# ggplot2 object modifications
# Since the function returns a ggplot object, it is possible
# to modify it following the ggplot2 grammar.
ggAPA(
apa.mtx = aggreg.mtx,
title.chr = "APA",
) +
ggplot2::labs(
title = "New title",
subtitle = "and subtitle"
)